The outlook for verification is as follows:
Necessity of Power Generation Measurement Technology - Consideration
Principle of Power Generation Measurement Technology - Algorithm
Installation of Experimental Equipment - Data Acquisition
Use Case of Power Generation Measurement Technology
Prototype - Requirement Specifications
Prototype - Production
Prototype - Evaluation: 1-series String, 9-series String
Improvement of Correct Answer Rate
MPPT Based on Power Generation Measurement Technology
Shadow Countermeasures
When a shadow falls on the panel, the power generation decreases, but ΔE/ΔI does not change in the low current range.
Therefore, the power generation measurement unit does not detect power generation decrease due to panel shading.
In the design of panel installation, shadows generally occur when the solar altitude is low in the morning or evening and the solar radiation on the panel surface is weak.
In "Extremely Low-Cost Solar Power", the influence of panel shading is only a slight decrease in self-consumption rate, so the priority of improvement consideration is low here.
However, when applying the power generation measurement unit to a system without commercial or battery backup, shadow detection seems necessary, so I started considering it.
Result: The existence of shadows appears in the change of Voc, but the influence of temperature change is even greater.
If the panel surface temperature is measured by a temperature sensor and the Voc change due to temperature change is removed, the Voc change due to shadow seems to be known, but the consideration was suspended there.
Is it possible to control the operation rate of the heat pump via DC bus? What is its wide range?
Can the heat pump operate stably with the output of 120-160VDC from 4 panels?
Can backup be done by matching commercial power when power generation falls below the power consumption of the heat pump?
Arc extinguishing measures when disconnecting during heat pump operation
(Draft) Power supply to electrical equipment of several A or more shall be arc extinguishing connectors
Commercial AC -> DC shall be half-wave rectification
Use fuse with arc extinguishing agent when fuse is blown

2023.1.20 Necessity of Power Generation Measurement Technology
If you shield a solar panel with a maximum power of 300W to the noon sun, you should be able to operate a 300W electrical device. Then, what W electrical device can be operated if shielded to the slightly weakened evening sun...?
The answer is... you won't know unless you connect the electrical device.
For example, if you connect a 100W TV and the solar panel does not down due to overload, it means this solar panel seems to have a power generation capacity of 100W now.
If the 100W TV does not turn on, this solar panel has less than 100W power generation capacity in the evening sun.
I repeat, you won't know unless you connect the electrical device...
We are using such unreliable things while devising variously. For example, using after charging the battery with a solar panel.
In this case, you can connect electrical devices up to the capacity limit of the battery (the capacity limit of the battery is specified in the specifications).
However, batteries are super heavy. And they have a lifespan.
Also, in solar power generation widely installed in houses, MPPT (Maximum Power Point Tracking) control is equipped in the power conditioner, but MPPT control cannot be used during independent operation when power fails, so only sufficiently small devices... for example, charging mobile phones or PCs can be used with peace of mind at that time.
Conclusion... Solar power generation has quite a few restrictions while saying cheap electricity can be used.
If we could measure "how many W of power generation capacity this panel has now", we could use solar power generation more comfortably. So I started thinking about how to realize the power generation measurement technology of solar panels.

2023.2.20 Principle of Power Generation Measurement
I felt it would be best to calculate the power generation capacity of a solar panel from the behavior of voltage and current of the panel output for the easiest measurement.
Also, the value ΔE/ΔI has an image of internal resistance, and it seems less likely to be affected by panel surface temperature from the characteristic graph, etc...
While repeating thought experiments and looking at the instruction manual of the solar panel, I noticed that the rising angle of the panel's EI characteristic graph seems to be correlated with the power generation capacity (W).
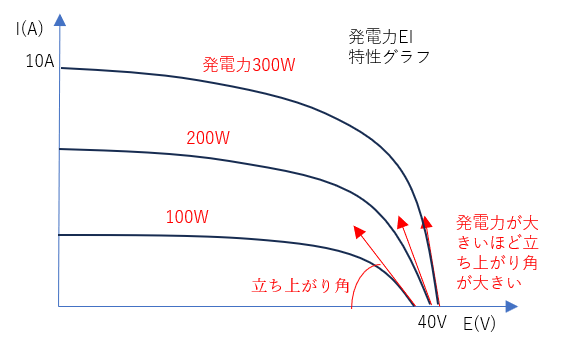
Just to be sure, I put a protractor on the characteristic graph and checked it, and it seems correct. Let's check with the actual machine...
2023.2.25 Setting up the Experiment Environment
On a sunny weekend, I built a stand with single pipes at the verification site so that the inclination angle of the panel (300W vertical 1.6m horizontal 1.0m) can be changed.
I have a lot of surplus single pipes used in large quantities for DIY solar, so it helps in such times.
When the sun and the panel face each other directly, the power generation capacity of the panel becomes the maximum 300W, and when the sun's rays and the panel become parallel, the power generation capacity becomes 0W.
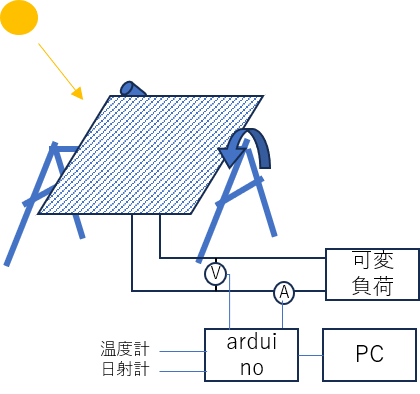
In order to know how many W of solar radiation the panel is receiving now, a pyranometer is attached vertically to the panel.
Multiplying the pyranometer output (solar radiation intensity W/m2 incident on the panel) by a proportional coefficient reveals the power generation capacity (W).
All other data such as panel surface temperature are imported to a PC via Arduino and made into an Excel table for later analysis.
Excel file image...

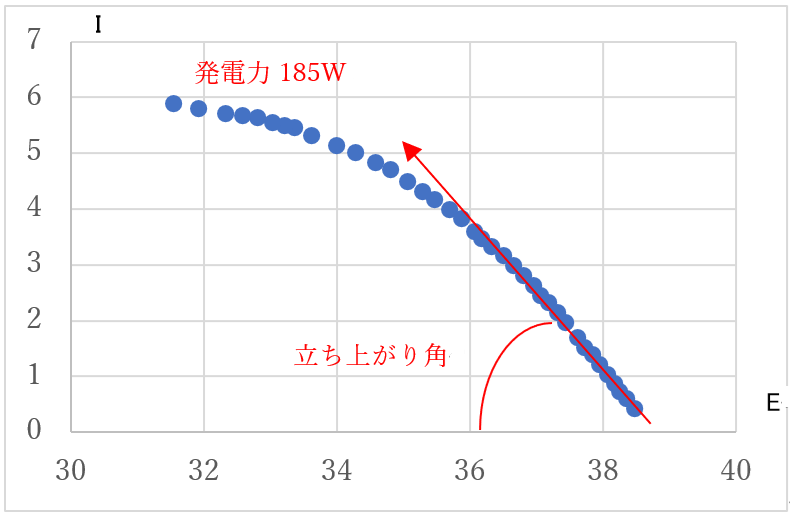
In weather with no clouds and stable solar radiation, while gradually increasing the variable load from I=0A, record the voltage and current of the panel output in Excel.
When the peak power is reached, finish the measurement and draw a scatter plot of horizontal axis E and vertical axis I, and the power generation EI characteristic graph is created.
When the same work was performed while changing the solar radiation intensity by rotating the panel, several EI graphs with different power generation capacities were created, and it was confirmed that there is a certain correlation between the rising angle and the power generation capacity.
2023.3.4 Correction of Power Generation Measurement Principle
Initially, we started with the idea that there is a correlation between the rising angle when the load is 0A and the power generation (W).
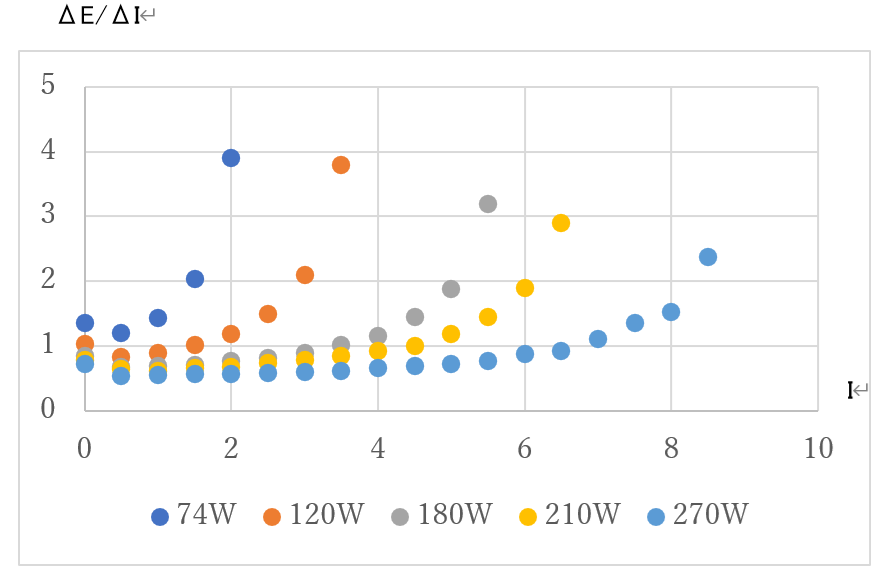
However, considering practical use, it would be convenient if power generation (W) could be calculated from ΔE/ΔI while load I(A) of a certain size is being used.
Considering that ΔE/ΔI in the Excel table represents the slope of the EI graph and the value near I=0A represents the rising angle, if we expand and interpret it, the value of ΔE/ΔI at a certain I(A) should be correlated with power generation (W).
When I draw a scatter plot of horizontal axis I and vertical axis ΔE/ΔI for several types of power generation, it seems that the value of ΔE/ΔI at a certain I(A) and power generation (W) are certainly correlated.
For example, if ΔE/ΔI=1.5 at I=2A, it can be seen that the power generation is a little less than 120W.
2023.3.18 Power Generation Change due to Panel Surface Temperature
From the examination so far, it was found that power generation can be calculated from changes in voltage and current of solar panel output. However, with the condition that it is at the panel surface temperature at the time of experimental data acquisition.
Actually, solar panels are exposed to strong solar radiation in summer and freeze in the early morning of winter, so the surface temperature of the panel changes dynamically from -10 to 60℃ throughout the year.
And the power generation of solar panels drops significantly as the surface temperature rises (power generation drops by 30% with a change of 70℃!).
So we cannot talk about power generation without knowing the panel surface temperature.
Therefore, it comes to measuring the panel surface temperature and correcting the power generation by only the difference from the standard temperature 25℃... but this is not easy.
Since the solar power generation system has multiple panels connected in series and the temperature differs greatly depending on the location, it is unknown where to attach the temperature sensor for correct measurement.
The method devised after repeating trial and error for about a week is as follows. I skipped the examination of the principle of why power generation decreases when panel surface temperature rises and decided on it.
First, what we have been calling power generation at a certain panel surface temperature until now is actually not power generation but solar radiation intensity incident on the panel (solar radiation intensity is independent of panel surface temperature).
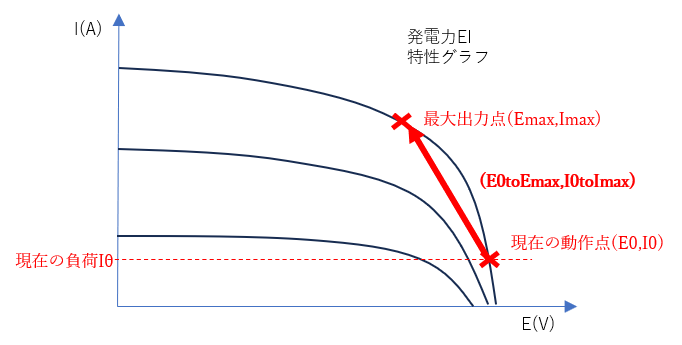
And define the difference between the maximum output point (Emax, Imax) at a certain solar radiation intensity and the current operating point (E0, I0) as E0toEmax and I0toImax.
Then, graph E0toEmax and I0toImax with I0 as the horizontal axis. Note that this relationship is considered to be less affected by panel surface temperature.
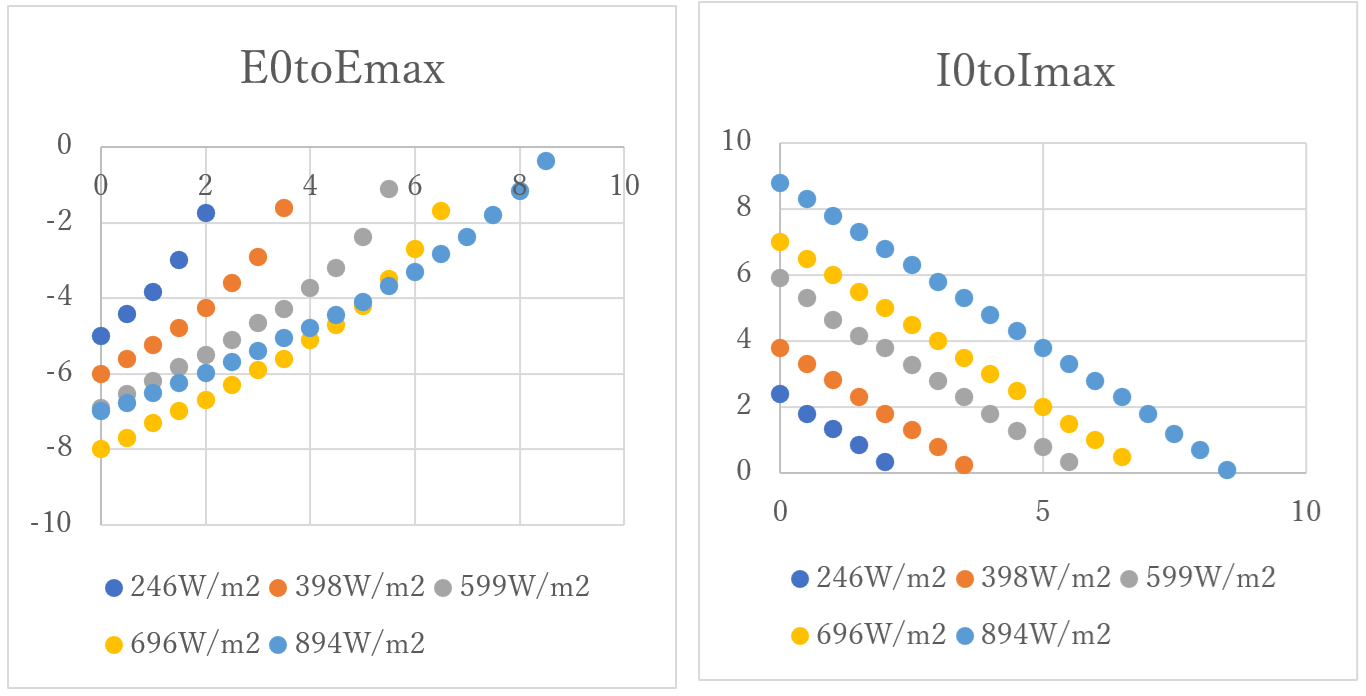
By doing so, if the solar radiation intensity currently incident on the panel is known, E0toEmax and I0toImax can be obtained from the graph.
Therefore, combined with the current operating point (E0, I0), the power at the maximum output point (i.e., power generation) can be obtained by (E0 + E0toEmax) × (I0 + I0toImax).
What makes me happy is that the power generation calculated by this method reflects the current panel surface temperature. Without measuring the temperature...
The reason is that the panel surface temperature is reflected in the current operating point, and even if the operating point changes, the influence of the panel surface temperature does not change significantly.
The error of this method can be assumed as follows.
Of the temperature coefficient of maximum output -0.38%/℃ listed in the panel catalog, the temperature coefficient of Voc 0.3%/℃ could be considered this time, so the remaining 0.08%/℃ remains as an unknown error.
In other words, it is thought that an error of 5.6% occurs in the panel operating temperature range -10~60℃.
If the error is about this much, it is acceptable for this application.
It is thought that the identity of the unknown error is due to the temperature coefficient of Isc (short-circuit current) and the failure to incorporate the tendency of the maximum output point to move to the upper left of the EI curve due to temperature rise, so further examination will be performed if necessary.
2023.5.20 Use Case of Power Generation Measurement Technology
In order to define requirements for the prototype, assume use cases for power generation measurement technology.
① "Extremely Low-Cost Solar Power" (Equipment Operation Rate Controlled Off-Grid Solar)
During load startup standby
Determine whether the minimum startup power has been exceeded according to solar radiation rise. Furthermore
Estimate whether it can operate stably and determine the operation rate of the load.
When prorating and using power generation with multiple loads
After starting the priority load, measure the surplus power generation capacity and start the remaining loads within that range.
When solar radiation drops while multiple loads are operating
Shutdown some loads early, then measure the surplus power generation capacity and consider how to control the remaining loads.
② Grid-connected Solar Power (Full Purchase, Surplus Purchase)
Compare the power generation (actual value) by MPPT of PCS and the power generation (theoretical value) by power generation measurement technology to detect failure of the power generation system.
During independent operation used during power failure
Display the currently available power generation as guidance so that loads can be used with peace of mind.
③ Self-consumption (Reverse Power Flow Prohibited) Solar Power in Factories
Measure surplus power generation capacity and use that power
For example, by using it for preheating boilers, reduce consumption of fossil fuels.
2023.5.30 Prototype Requirement Definition
Measure the maximum power generation at the current solar radiation of a string of 300W class panels x 1 to 9.
Measurement accuracy of maximum power generation (W) is ±10% relative to the true value.
However, fluctuation of continuous measurement values at intervals of several seconds shall be measured at ±5%.
Time allowed for measurement is 10ms.
Do not detect power generation decrease of shaded strings.
(Note) The main purpose of power generation measurement is to provide "current power generation" information for load control following fluctuations in solar power generation.
As an additional function, notification that power generation has dropped sharply due to solar radiation fluctuation or shadow on the string is performed, but safe shutdown of load and backup by battery or commercial power supply must be performed individually.
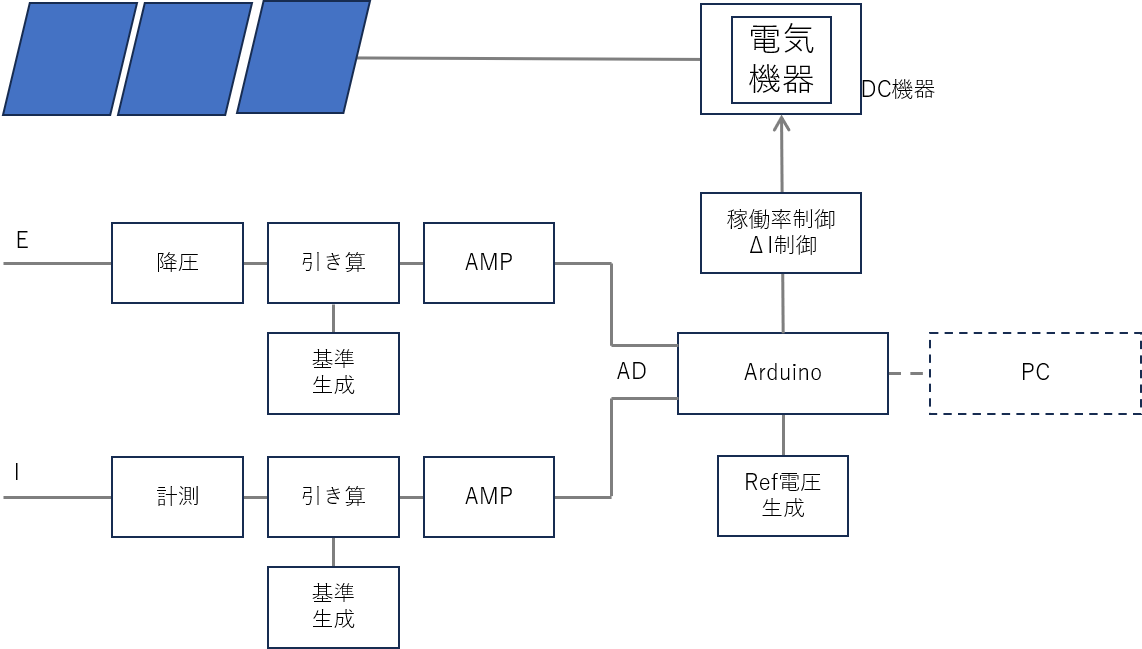
Hardware Block Diagram:
In a system of solar panel x 1, the IV curve changing with the four seasons must be measurable with a resolution of 1mV (resolution of I is not of much concern).
However, in a system where panels of the same model are connected in n series, if voltage measurement is considered to be averaged, the resolution may be n times.
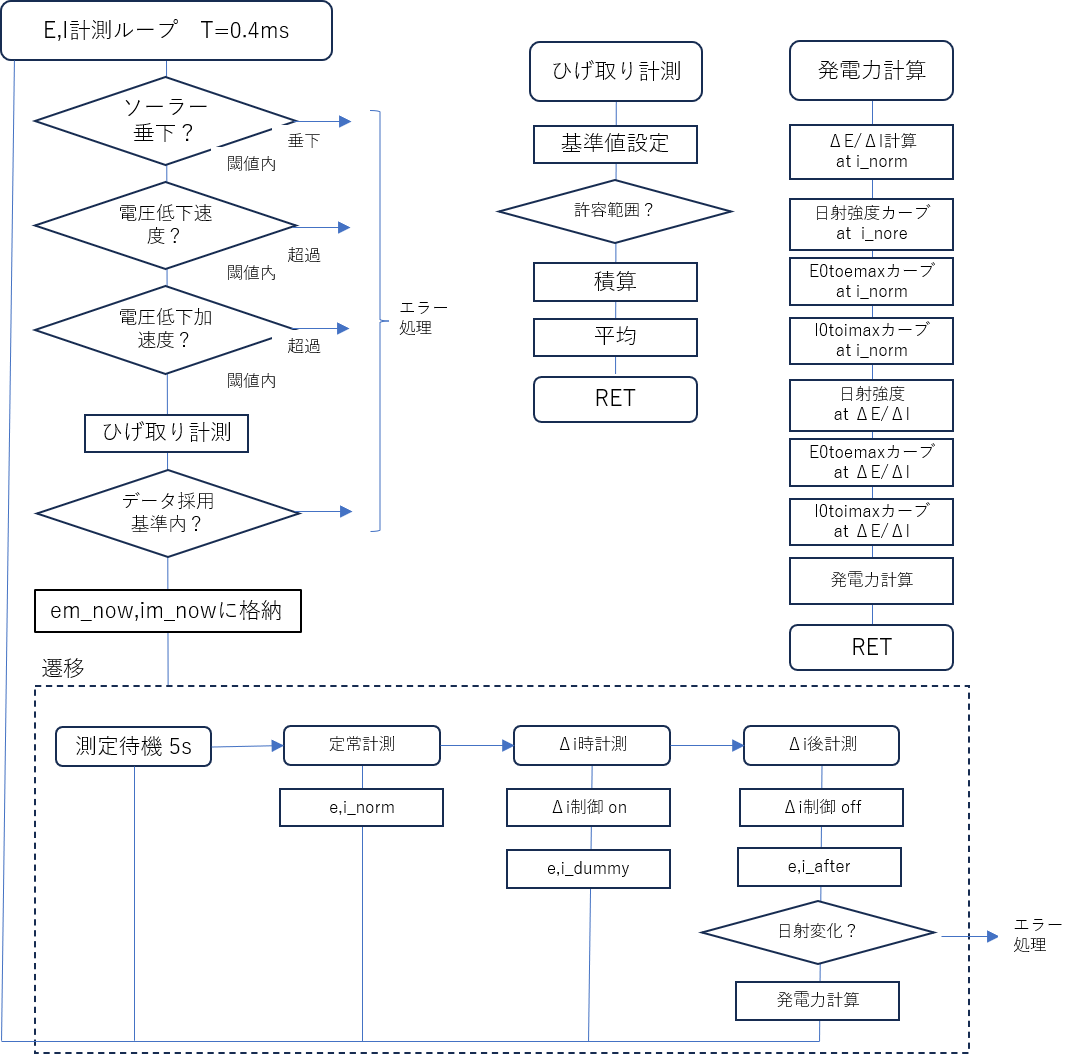
Software Flowchart
Since there are many noise sources around the power generation measurement unit and step changes in signals must not be blunted, there is a limit to hardware noise removal. So remove noise with software processing.
Also, if solar radiation changes during measurement, a large error occurs, so discriminate it and invalidate that measurement data.
2025.1.1 Look Back Once
Already 1.5 years have passed since the requirement definition of the prototype. What I was doing during that time was trial and error.
It means I spent 1.5 years cleaning up what a pro would probably finish in 3 days. I reflected many times that I dabbled in something beyond my means, but I was able to continue sluggishly because self-control was allowed, saying that continuation is important even if it is clumsy.
If I were doing it as a salaryman, I would have been fired long ago.
The problem is that a radio boy from the 5-tube super (don't worry if you don't know) era suddenly stepped into the world of millivolt measurement thinking it would work out somehow after a long sales career.
But probably amateurs in that field are interested in value exploration and feasibility verification of new technologies using their own money.
Since no one helps and it's annoying to cause trouble, I end up making the prototype myself, so I list what I have done hoping it will be helpful to such people a little.
I wish I could explain in detail, but I don't have such technical skills, so please forgive me...
Estimated the operating range of Arduino UNO minima R4 by experiment. Because there is no information provision up to there.
Estimated nonlinearity near zero point of current measurement chip by experiment.
Deceitfully used cheap craft electronic load -> Damaged many power transistors.
Wanted a D/D converter capable of external control of Cc (constant current) level, so devised and mastered the technique of floating the legs of surface mount chips of a D/D converter purchased on Amazon with a soldering iron and a cutter knife.
Made an experiment circuit on a breadboard and fell into the trap of voltage drop due to minute contact resistance magnificently. Fell into it for quite a long time.
-> I wanted someone to say that building a mV circuit on a breadboard is prohibited.
Abnormal oscillation of operational amplifier.
Abnormal oscillation of temperature measurement chip.
Lack of power to drive Arduino's A/D.
Exclusion of disturbance during measurement. Intrusion of reflected light from other panels. Shadow on pyranometer. Inverter noise.
Trade-off between solar radiation change speed, measurement speed, and measurement error.
Mastery of technique to embed all processing in measurement loop rotating at fixed time to deal with sudden decrease in solar radiation.
Judgment of validity of measurement results. Especially exploration of method to know whether solar radiation fluctuation occurred during measurement.
Great confusion trying to structure the program without experience.
-> Since Arduino allows label jumps, I used labels extensively and felt refreshed.
Bug fixing due to various causes.
I feel there were more, but there are many memos that cannot be analyzed, so I will stop here.
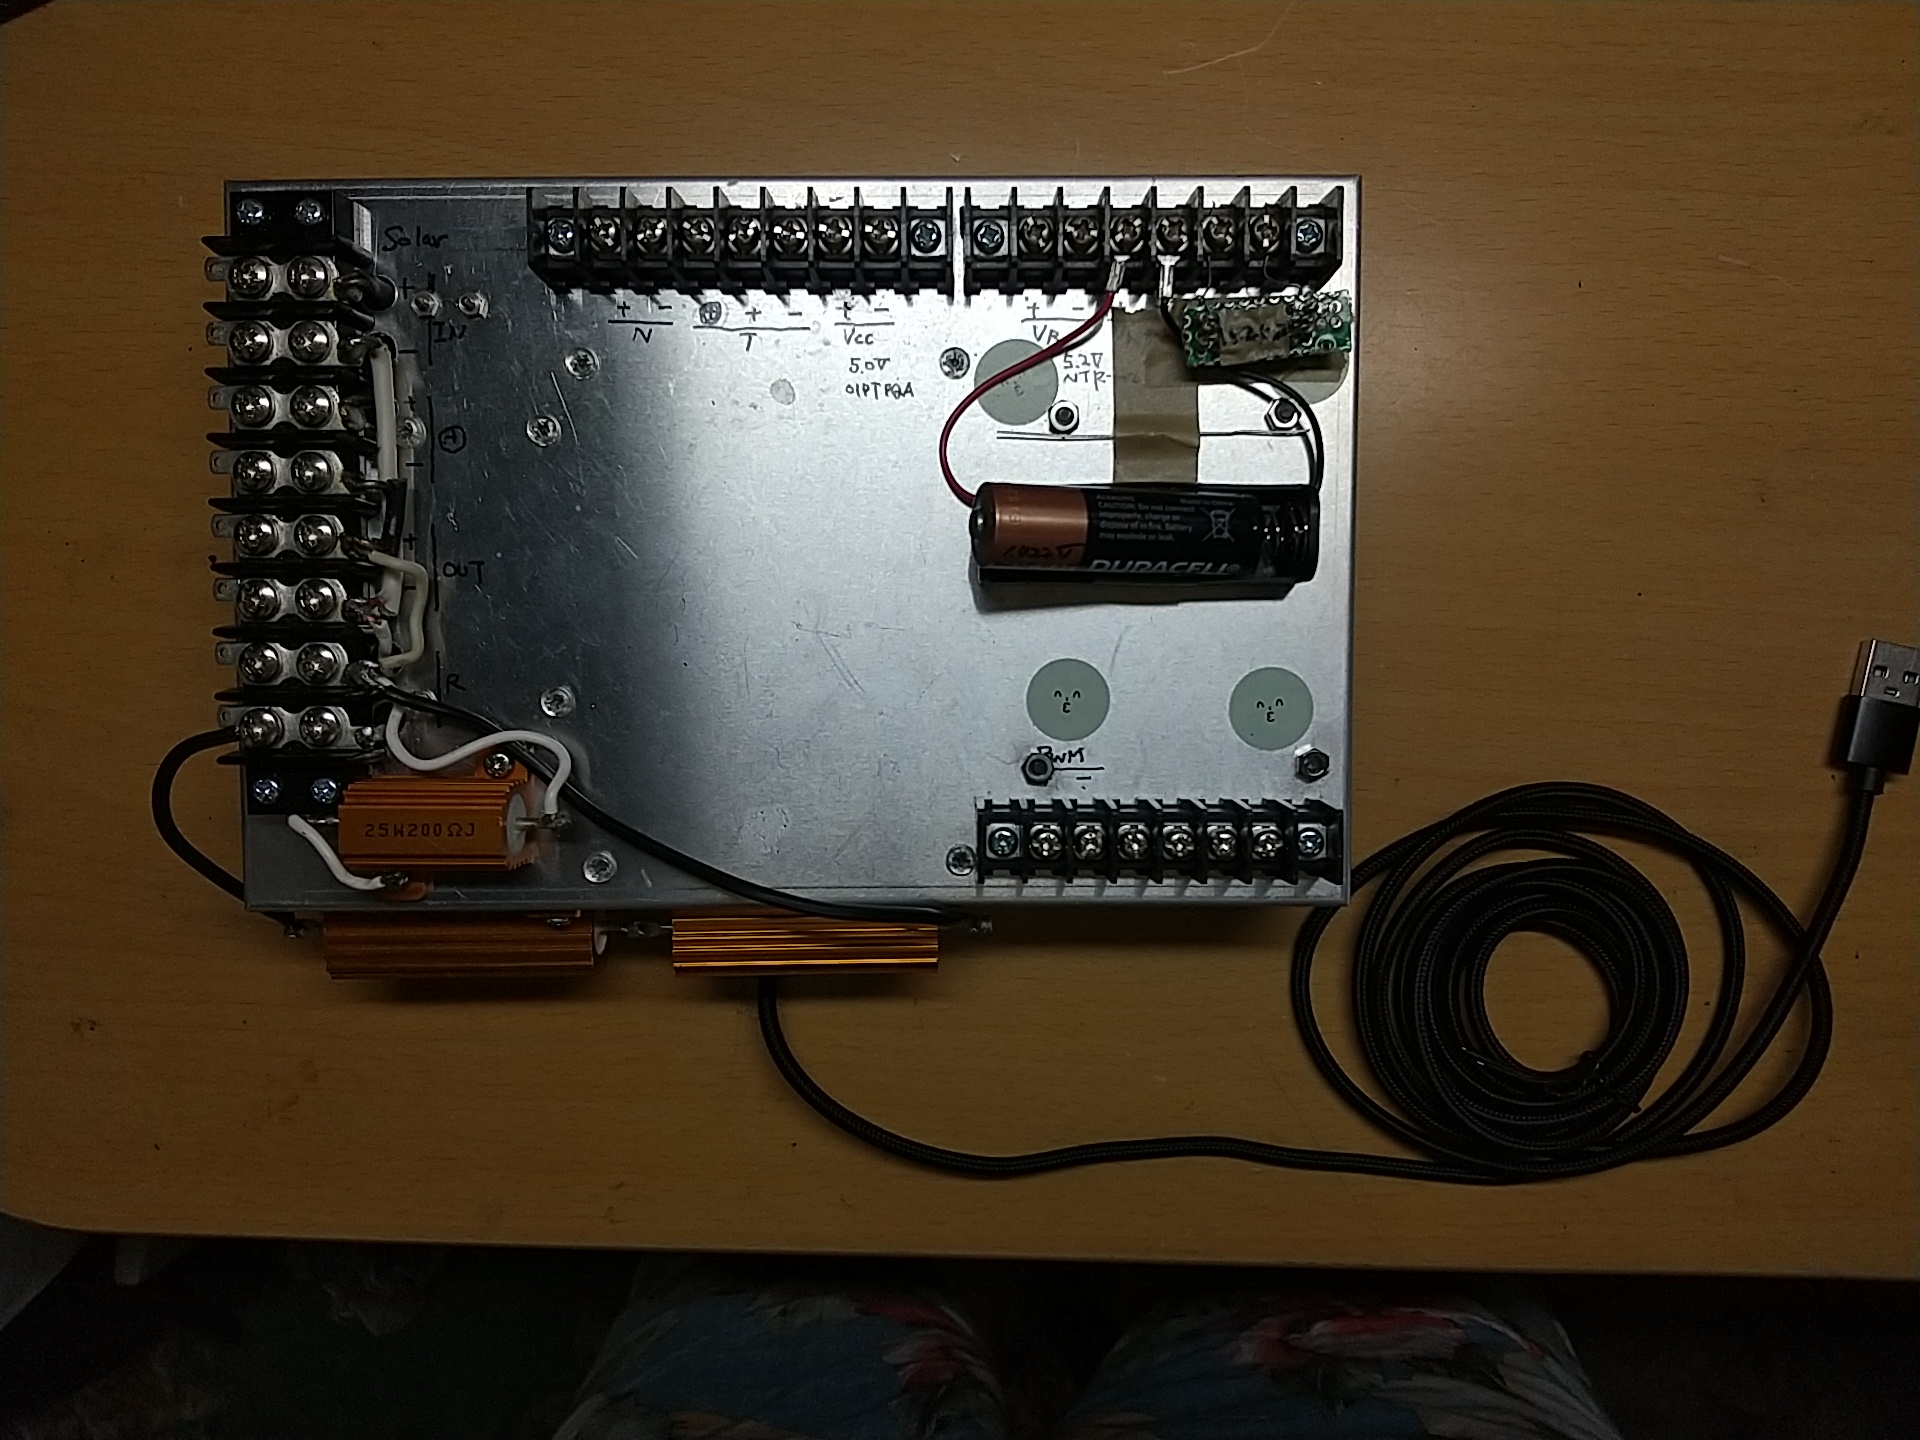
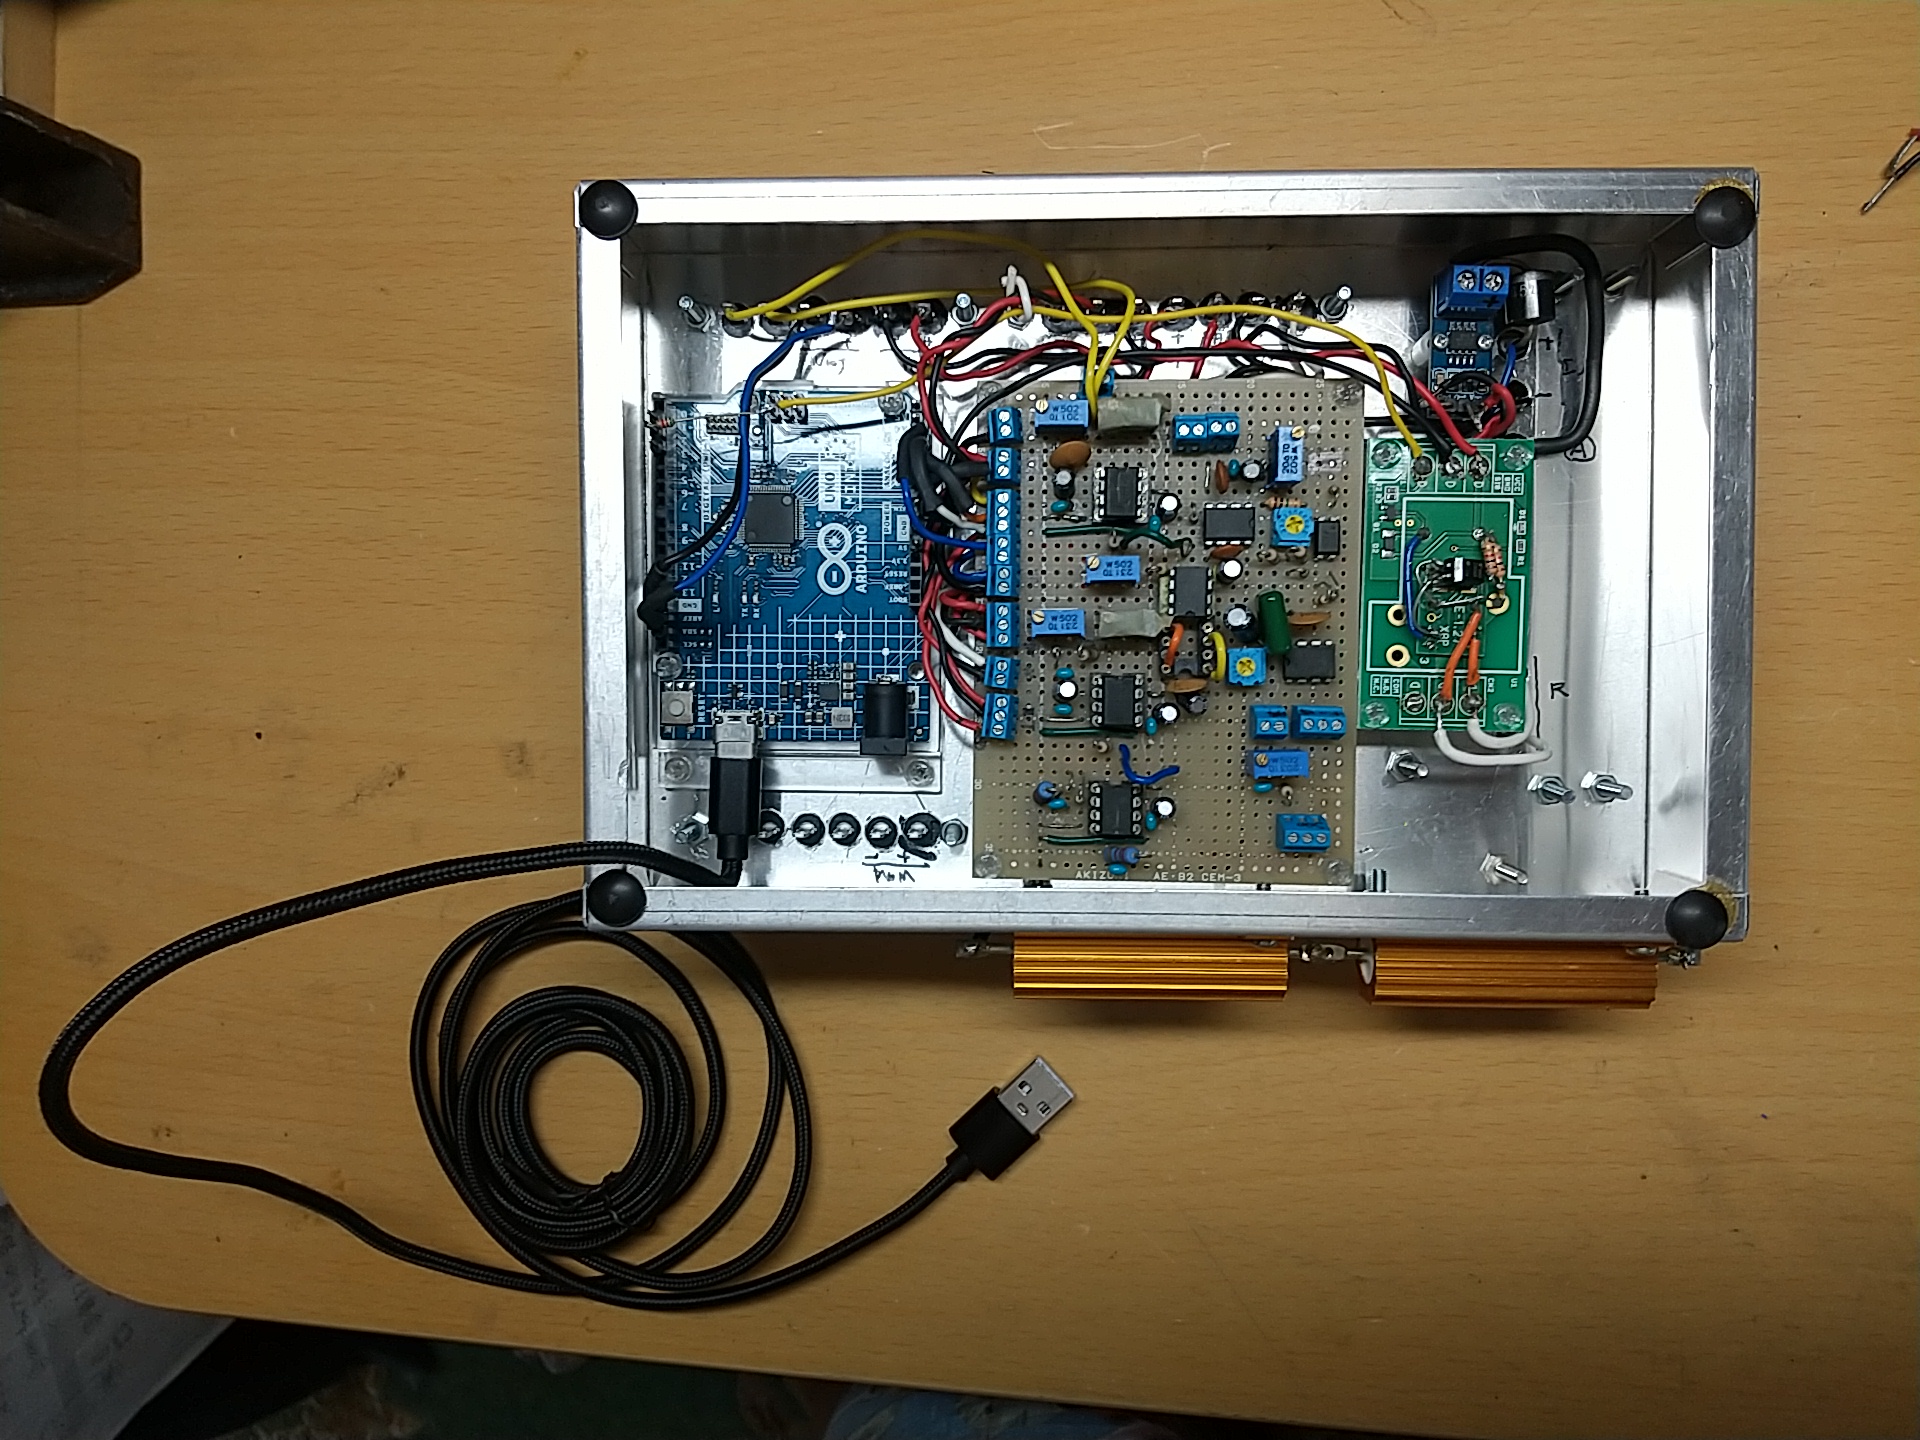
2025.1.20 Prototype Production
Analog input is input to AD of Arduino UNO MINIMA R4 via instrumentation amplifier.
Output PWM signal for ΔI control and operation rate control at DO.
2025.4.14 Performance Evaluation Result Single Panel
Although it is a very rough evaluation, I tried to make a scatter plot of the correct answer rate under various solar radiation conditions (W/m2) and operating points (E, I).
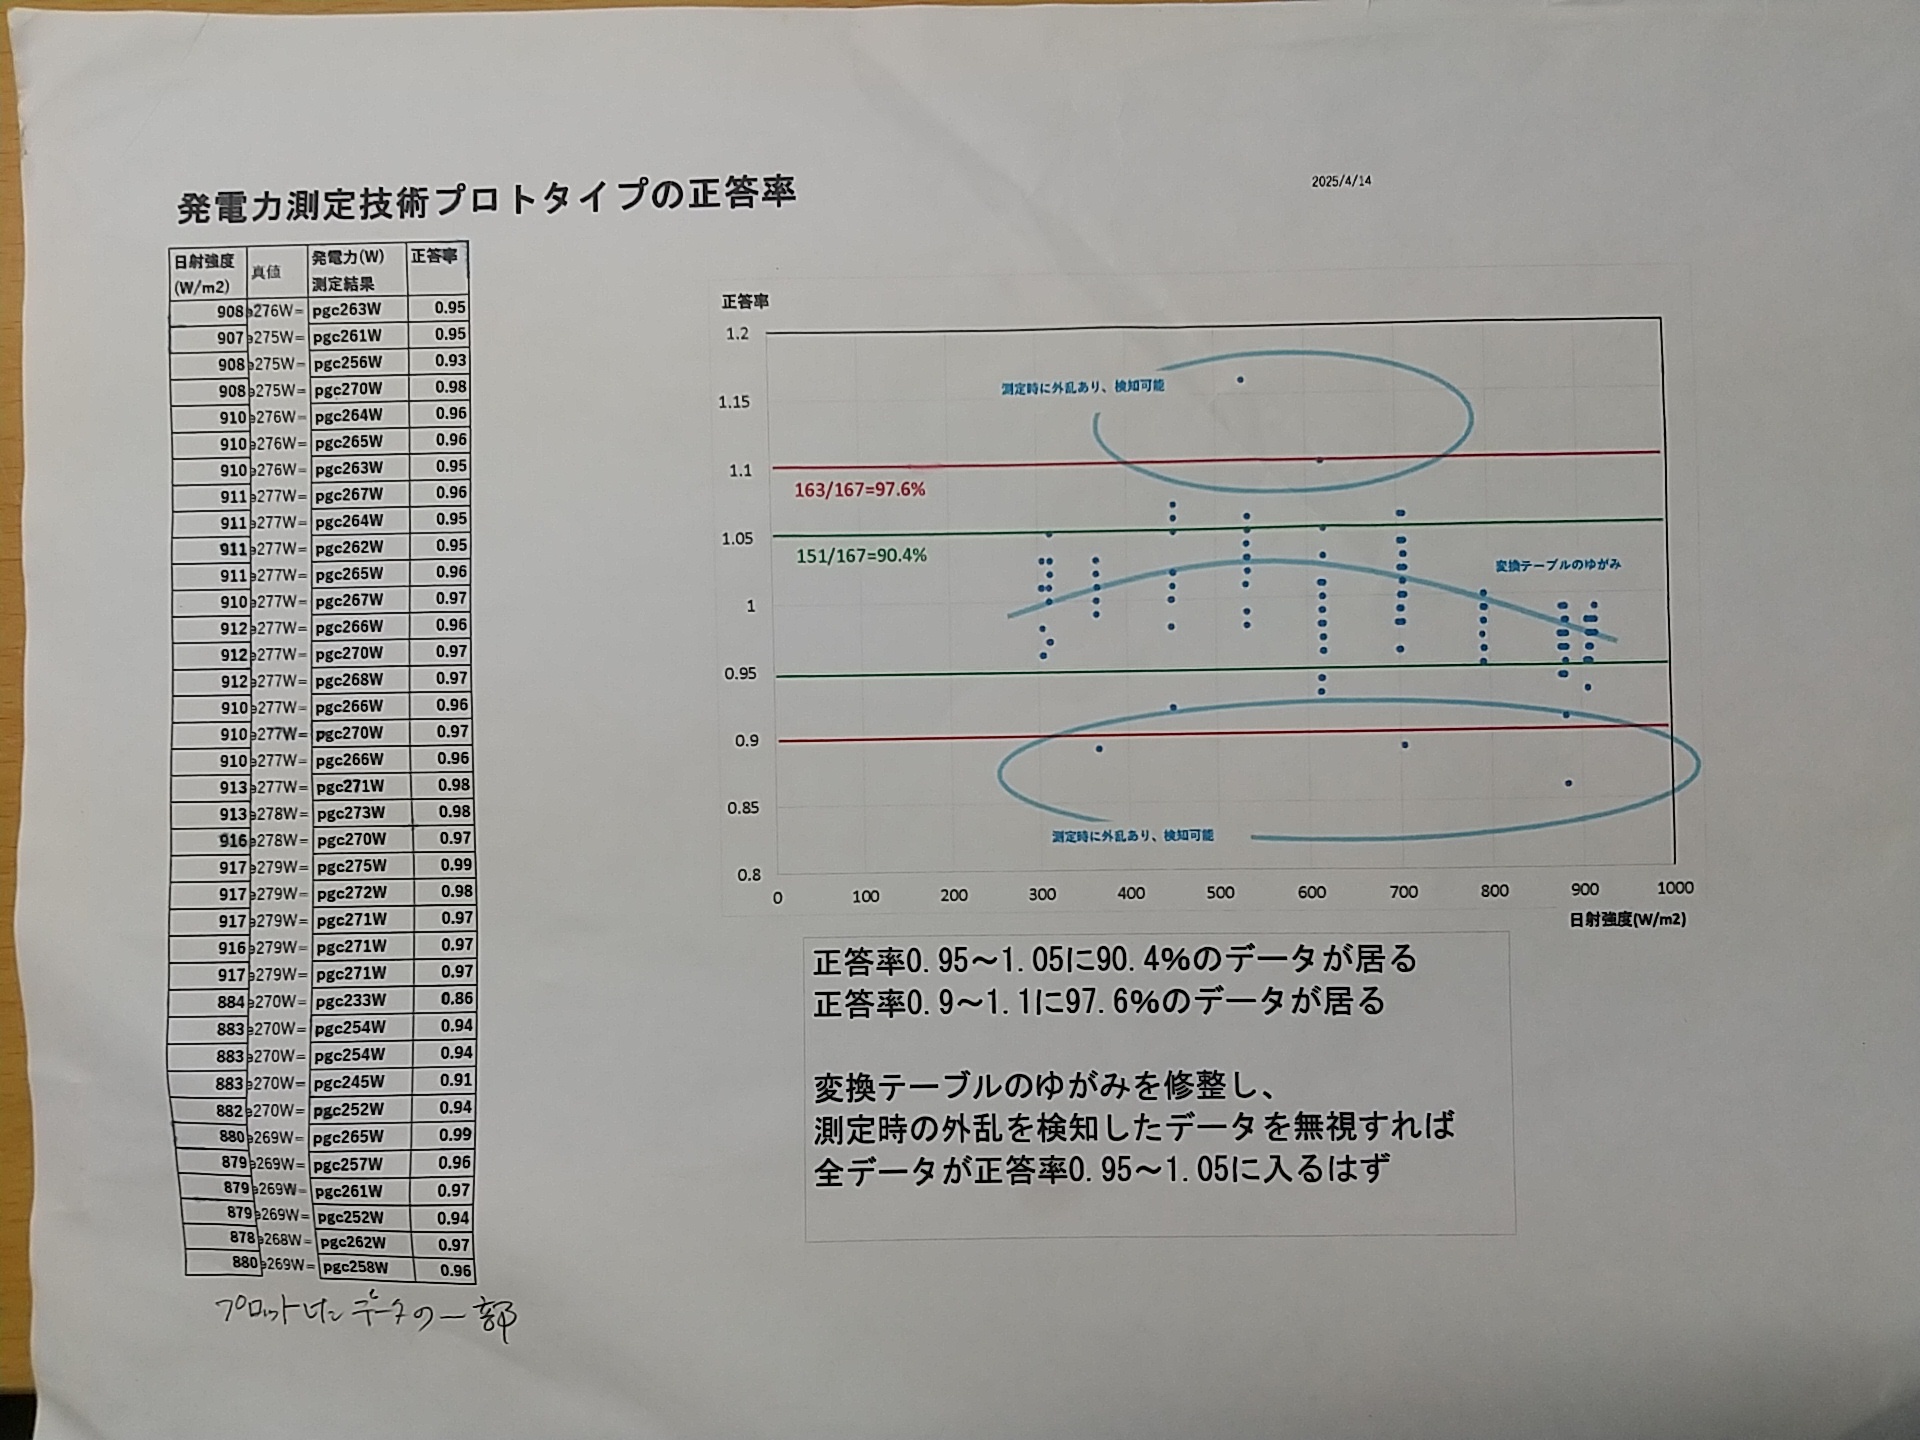
Result: A correct answer rate of 0.95-1.05 seems expectable by correcting the distortion of the interpolation formula of the conversion table built into the power generation calculation program and excluding data with solar radiation change during measurement.

2025.9.16 Can it measure without problems even with a 9-series string?
Knowing that this algorithm is not altogether wrong, I decided to check the power generation measurement performance with a 9-series string with a somewhat happy feeling.
Since the prototype originally supported multiple panels, experiments can be done by setting parameters with input voltage reduced to 1/9. The measurement target is the 9-series string of the power selling site.

I was surprised that when connecting 340V of 9-series to the prototype, it took about 1 second for the reading of the tester attached just in case to rise to 340V. Note that the tester was connected in parallel to the panel voltage input of the prototype.
I had a bad feeling, but when I ran the measurement program as it was, the error of the measured value was as large as 20%, and the reading of ΔI of load operation rate step change was wandering around 0.1A against the design value of 0.15A.
At this stage, I thought that when it was made 9-series, the step response time became considerably long for some reason, and measurement was performed before the step change was finished.
Is it due to panel impedance or low-pass CR circuit of prototype input...?
In the case of 1-series, the time to step equilibrium was set to 10ms, but it seems insufficient.
If the time to equilibrium is too long, solar radiation often fluctuates during that time, and power generation measurement itself may not be valid.
The happy feeling blew away...
I also discovered that it was reading noise that could not be completely removed by the whisker removal measurement algorithm. Perhaps because of that, I noticed that the correct answer rate of measurement values in strong solar radiation decreased to about 70-80%. Even though performance was certainly coming out in fine weather...
First, find the cause of this phenomenon, reflect countermeasures in the prototype, and confirm the effect.

2025.10.17 Can it measure without problems even with a 9-series string (Continued)
It turned out that the reason why step response takes time in 9-series is because PCS was used as a load.
When I tried using a resistance load, it took only a few milliseconds to respond. Therefore, decide to perform 9-series evaluation with resistance load, and separately determine the optimal setting in the case of PCS load.
Another verification is verifying the feeling that the measured value fluctuates greatly upwards or downwards when it is cloudy or thin cloudy. I want to return to the 1-series system to observe this and determine the limit of the current power generation measurement algorithm.
I feel that the whisker removal measurement routine has a habit, so I want to improve it if possible.

Regarding Response Delay:
Confirmation of Hardware Aspects:
 Suspect the delay of the tester itself.
 What if the CR circuit is removed?
Confirmation of Program Aspects:
 Extend the time to step equilibrium to 400ms, check the measurement value change every 1ms during that time, and set the optimal waiting time.
Identification of Noise Source:
 Try connecting a resistance load instead of the power conditioner in independent operation mode used as a load.
 Confirm whether cloudy solar radiation contains noise by contrasting with measurement experiments in sunny weather.
Confirmation of decrease in correct answer rate at high solar radiation:
 This was also confirmed in 1-series. Until now, I wanted to know if the basic performance was feasible for prototype evaluation first, so I performed it with as stable solar radiation as possible, so I have pretended not to see this part.
If necessary, improve to an algorithm that is useful even with unstable solar radiation in cloudy weather.